Monitoring Pipelines
You had your first look at the Monitoring Page in the Getting Started section. Now let's take a deeper dive.
Let's look at each section individually.
Pipeline Runs#
This section consists of all your pipeline runs, including Review pipelines. Each pipeline is represented by a row. The following information is available on each one.
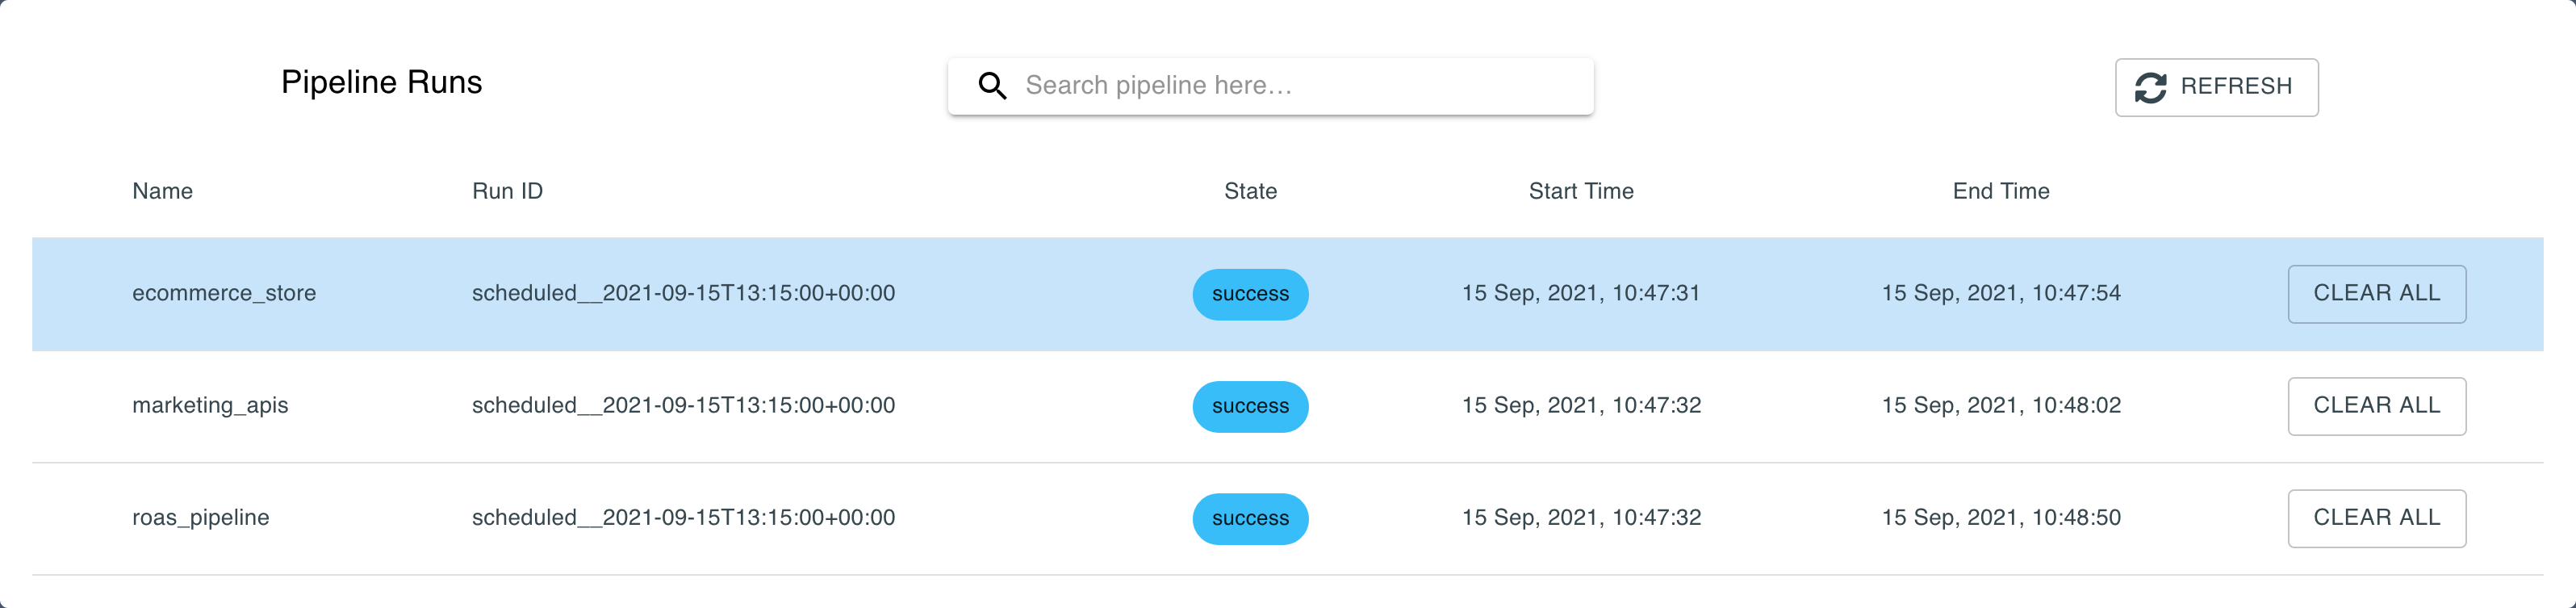
Name#
The name of each pipeline.
Run ID#
The ID of the last pipeline run. This consists of the timestamp it is scheduled to run at.
State#
The status of the pipeline consist of the following:
- Running - the pipeline is currently running
- Success - the pipeline run was successful
- Failed - the pipeline run failed
Start Time#
The time the last pipeline run started.
End Time#
The time the last pipeline run ended.
CLEAR ALL#
The CLEAR ALL button clears the entire pipeline and reruns it. Use this if you want the pipeline to run before the next scheduled run. The pipeline will still run on the next scheduled run even if you clear it.
REFRESH#
The REFRESH button on refreshes the data on the entire page. Click this to see whether pipeline runs have updated.
Tasks#
Clicking on a pipeline will open up all the current model runs associated with that pipeline in the Tasks section. For each model task the following information is available along the row:
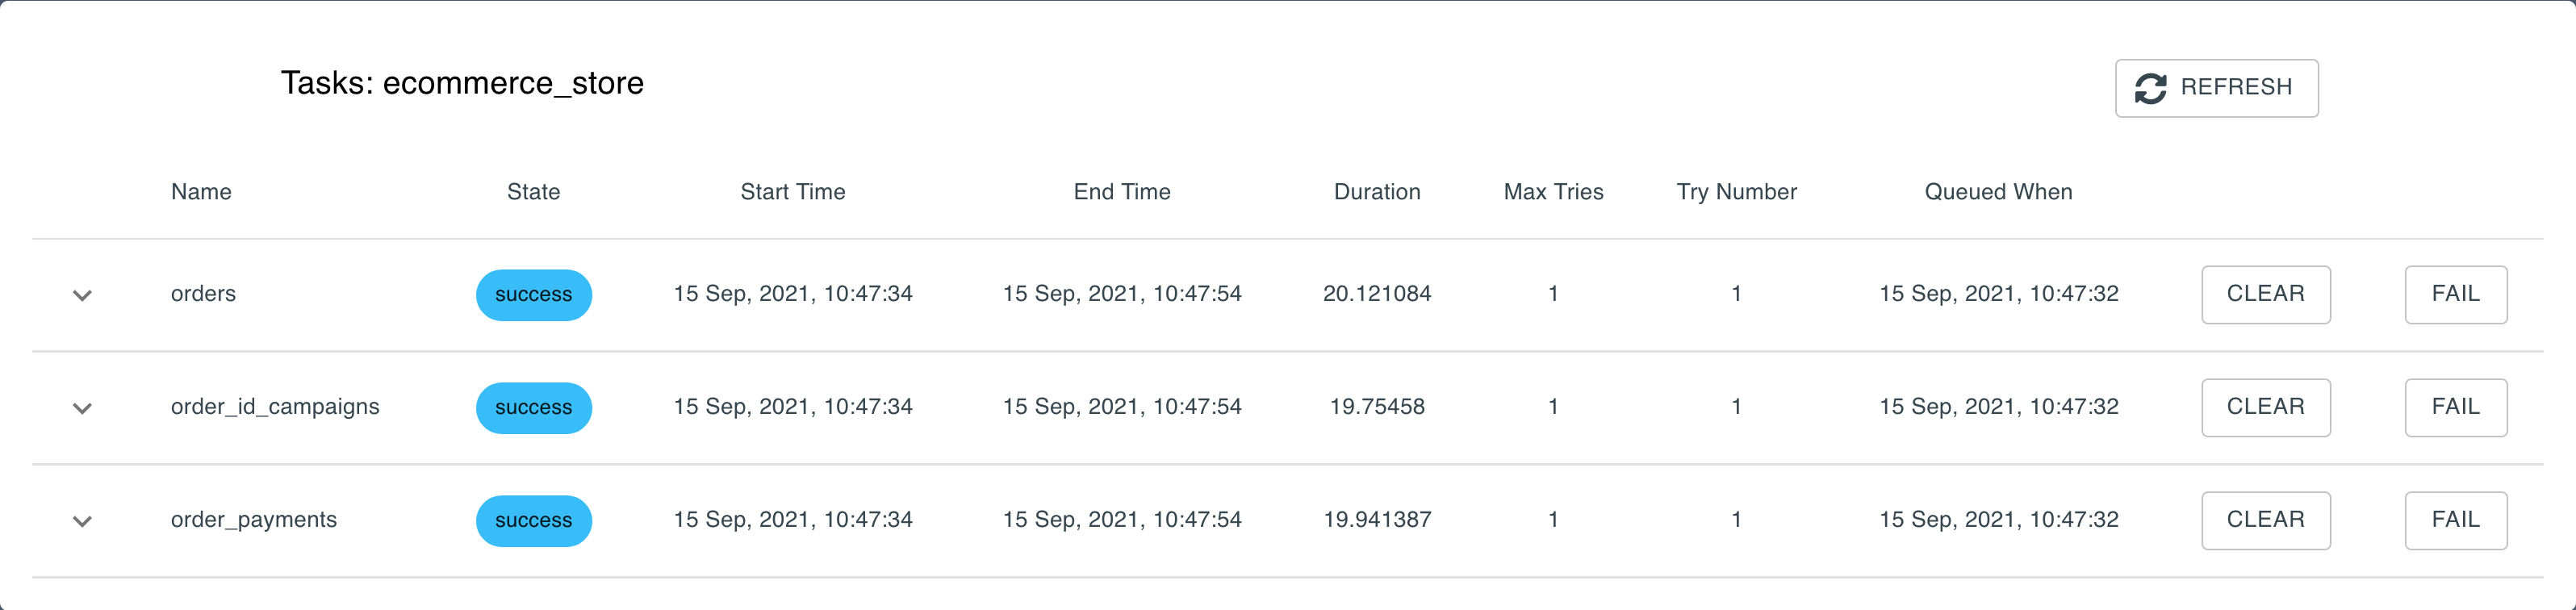
Name#
The name of the model tasked.
State#
The status of the pipeline consist of the following:
- up_for_reschedule - the model task run is being rescheduled for a run
- queued - the model task run is queued to run next
- running - the model task is currently running
- success - the model task run was successful
- up_for_retry - the model task run was not successful and is up for a retry
- upstream_failed - the model task run failed due to a dependency failing
- failed - the model task run failed
Start Time#
The time the last model task run started.
End Time#
The time the last model task run ended.
Duration#
The duration of the last model task run in seconds.
Max Tries#
The maximum number of tries during the last model task run.
Try Number#
The current attempt to run the model task.
Queued When#
The timestamp the model task is next queued to run at.
CLEAR#
The CLEAR button clears the model task and reruns it. Use this if you want the model task to run before the next scheduled run. The model task will still run on the next scheduled run even if you clear it.
FAIL#
The FAIL button fails the model task and sets the state to failed. Use this if you want to stop a task from running entirely. The model task will still run on the next scheduled run even if you fail it.
REFRESH#
The REFRESH button on refreshes the data on the entire page. Click this to see whether pipeline runs have updated.
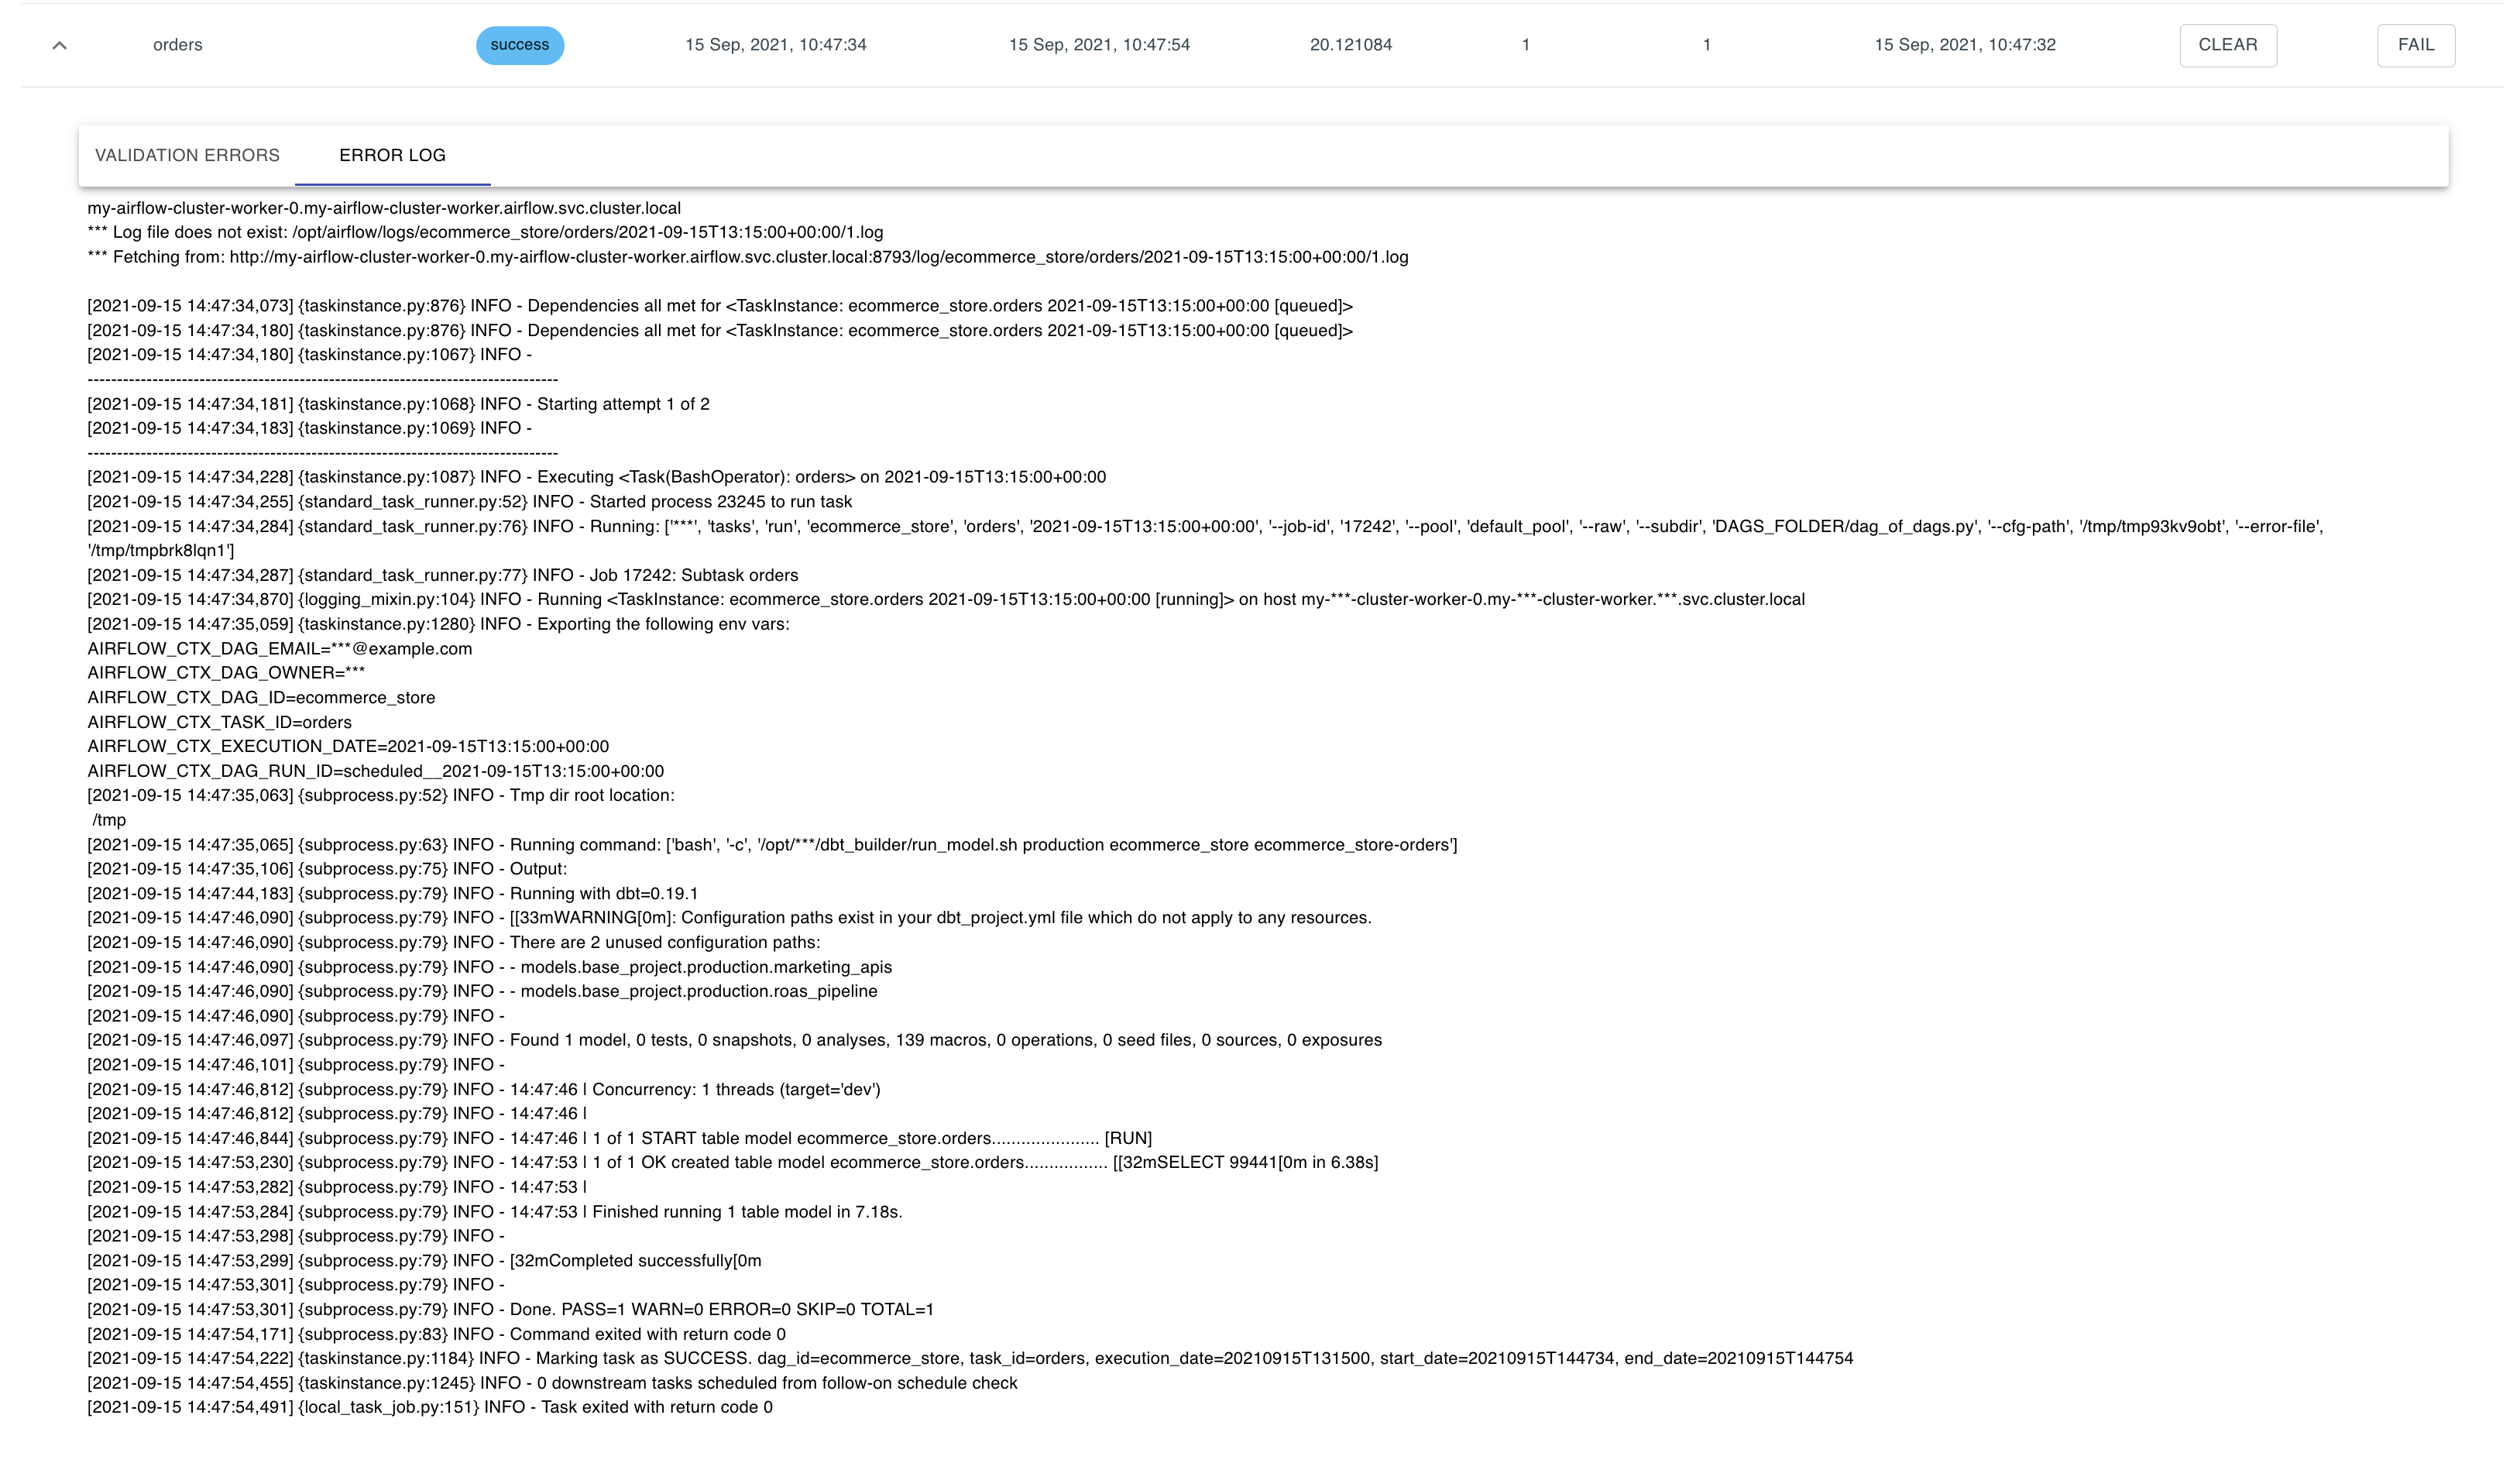
Each model task row has a dropdown that reveals validation errors and error logs.
Validation Errors#
Displays each of the validation runs tied to the model. To find out more on validation runs visit the validations section.
Error Logs#
This displays the most recent error logs. This is used to debug an issue.
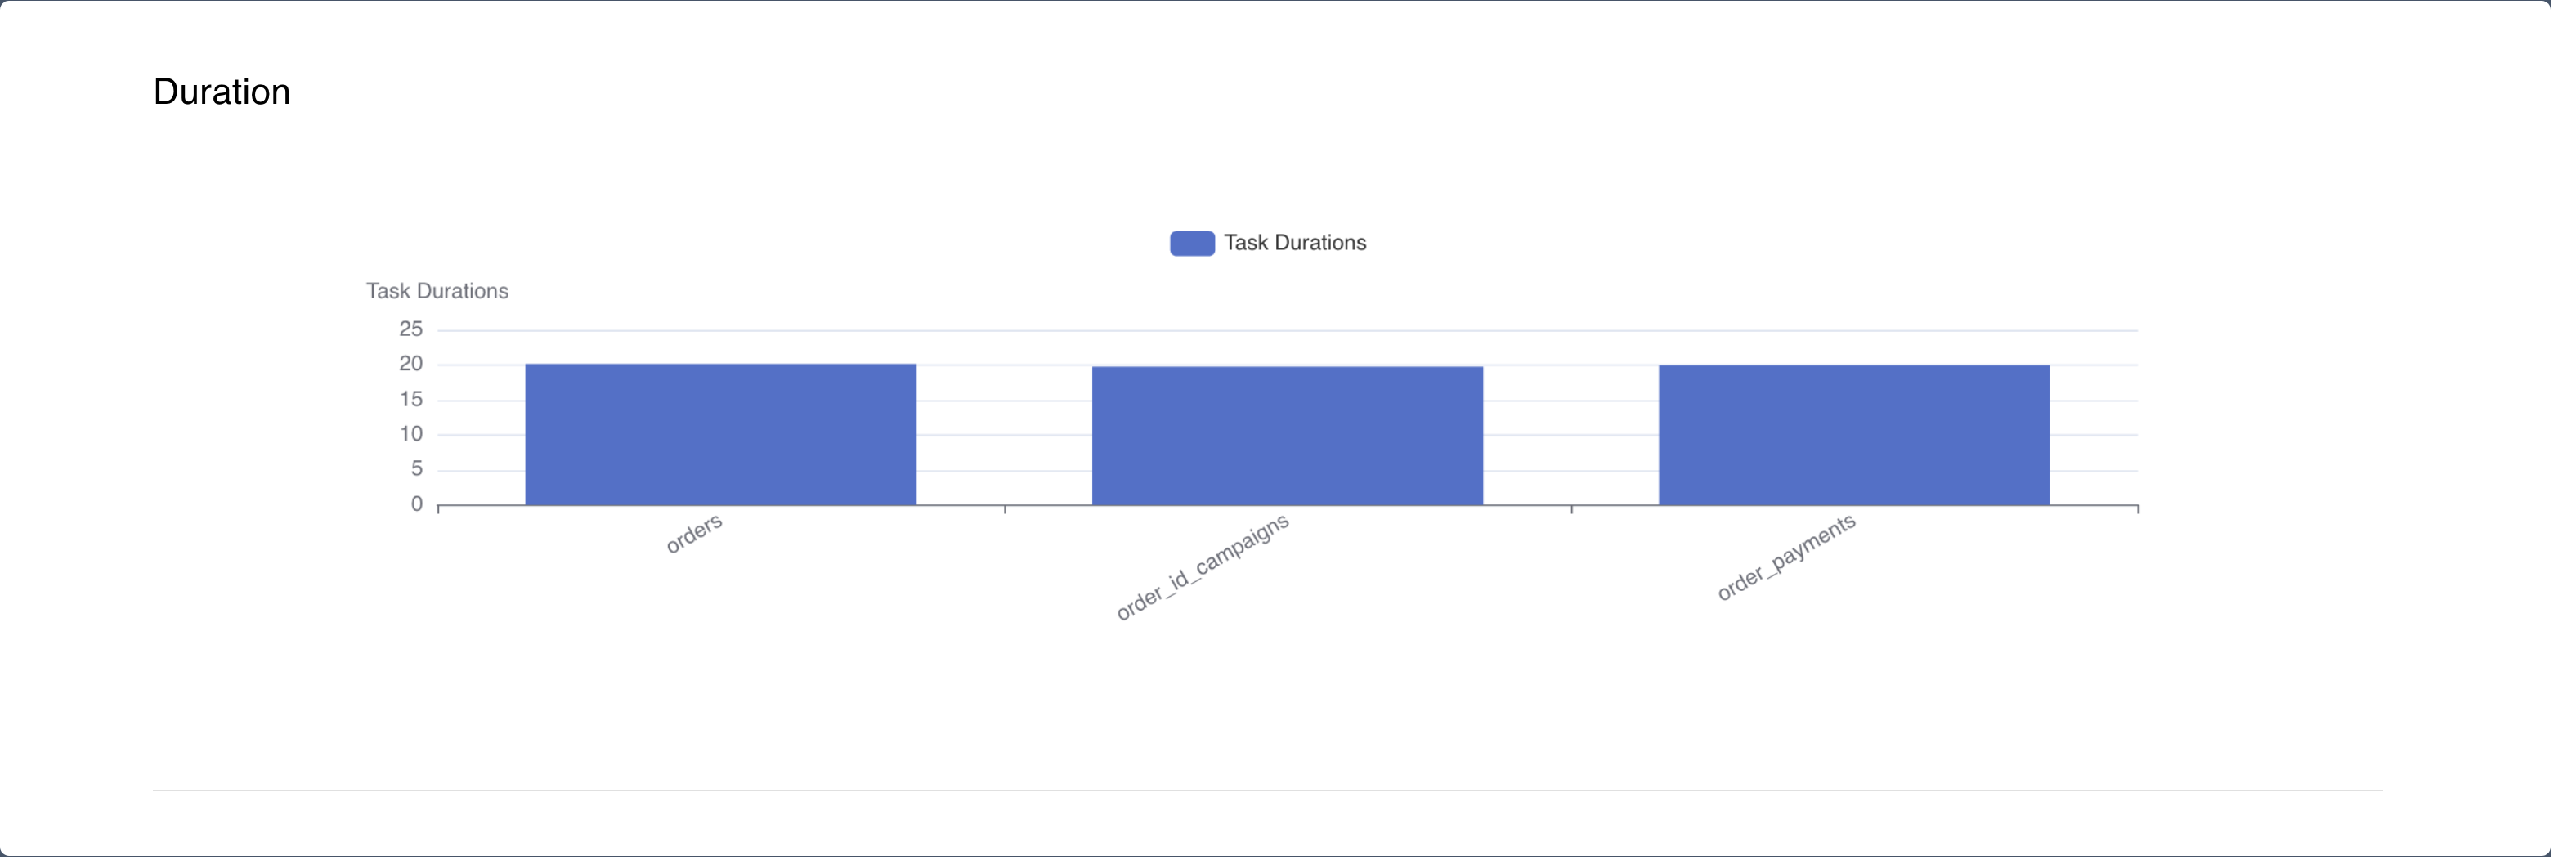
Duration#
The duration graphs compares the durations of each of the latest model tasks of the selected pipeline.
Pipeline Monitoring Header#
To ensure that the team is aware of any failures the Pipeline Monitoring Header is at the top of every page. The three sections consist of the following:

Running#
Current production pipelines running.
Failed#
Current production pipelines failed.
Success#
Current production pipelines that were successful.
It is important to note that these do not include review pipelines.